For the last 18 months X-MR have been conducting political research on a private basis using a wisdom-of-crowds methodology, some of which is described in our News page.
2016 presents the opportunity to validate wisdom-of-crowds polling in the succession of state primary elections. This is the second in a series of studies of the USA Presidential Election. Last week we examined the Iowa caucus; at first sight with disappointing results, because our front-runner did not win either contest. However, our respondents were only saying who they thought was most likely; and on that basis not even a majority thought that Trump would win the Republican contest - so we can hardly be startled that a candidate who was thought (in aggregate) to have a less than even chance did not win. The Democrat contest was thought to be more one-sided but even then Sanders' odds were seen as around 50:50.
Note that our studies do not purport to estimate share of vote, only to rank order the candidates in order of probability of winning. Further inferences from our results to e.g. winning odds or share-of-vote require some modelling process. We hope to learn a little about such possiblities from studying a number of electoral contests.
With that in mind, here are our results compared with the reality in Iowa:
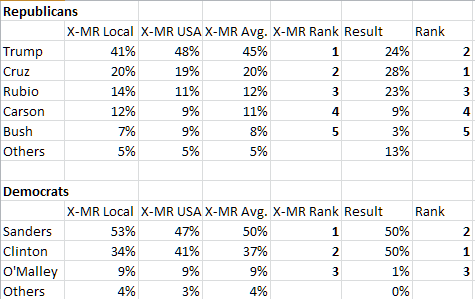
We had both the top two Republican and top two Democrat positions in the wrong order. Our local respondents were more correct about the Republicans and more wrong about the Democrats.
So let's move on to the situation in New Hampshire.
One of the wisdom-of-crowds tenets is that a wise crowd needs to be diverse, but not necessarily expert in the domain of interest. To examine this we ran four surveys last week, two concurrently for the Republican vote, and two for the Democrat. Each was a Google sample of 500 adults, with one sample being selected from the USA as a whole, and the other drawn from New Hampshire only. Each respondent was asked who they thought would win either the Democrat or Republican primary, whatever their personal preference.
All surveys were conducted using Google Consumer Surveys. Results shown are unweighted.
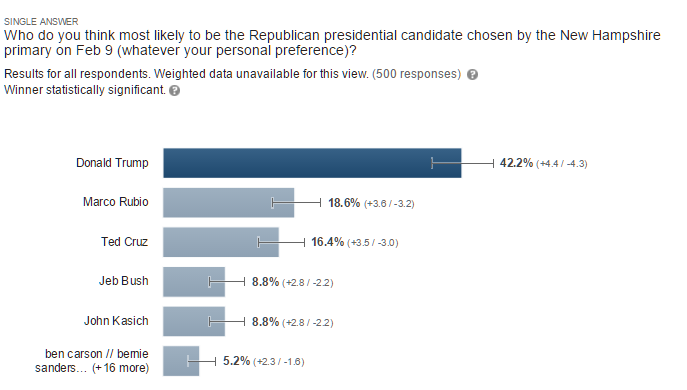
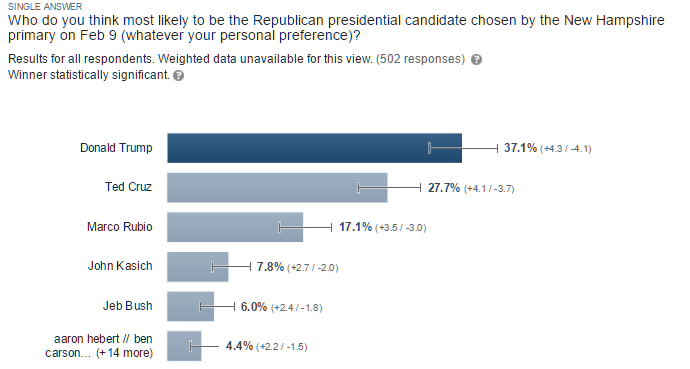
The Republican contest
The national and local samples both show Trump as the clear winner. Nationally Cruz is the clear number two but locals have Rubio as number two by a small lead. There is little difference between Kasich and Bush behind the front-runners, in either survey.
New Hampshire respondents (survey conducted Feb 4-8)
All USA respondents (survey conducted Feb 4)
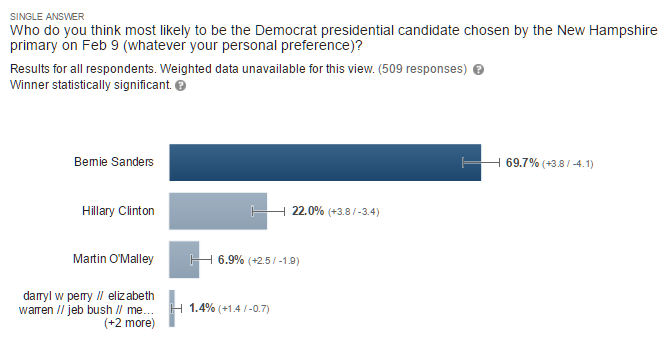
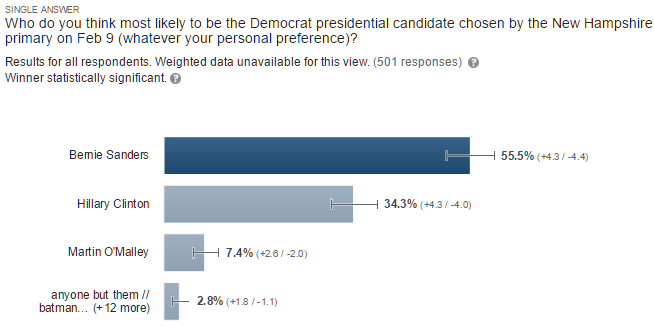
The Democrat contest
Both surveys show Sanders as the winner and Clinton a distant second. Note that O'Malley had already left the race before our surveys went to the field. This suggests that there is a significant level of 'noise' in our results. The three candidates were presented in a randomly selected order, so there may a tendency to select an answer randomly, or to select the first one presented. Again, we have to wait for more data to make an assessment here.
New Hampshire respondents (survey conducted Feb 4-8)
All USA respondents (survey conducted Feb 4)
Sampling
These results are presented unweighted.
Representativity becomes important when results are potentially biased because some contributing groups differ in their responses. With wisdom-of-crowds, the concern becomes not whether different demographic groups will place their votes differently, but whether they differ in their expectation of the outcome. What we typically find in this kind of survey is that the differences in judgement between age and gender groups are not significant - the overall estimate being within the confidence limits of the estimates for each subgroup.
For instance, comparing regions in the Republican All USA sample:

Note US West Trump: range 20.9% - 42.6% versus overall Trump 33.0% to 41.4%
Conclusion
Though it is easy to infer the predicted order of the outcome as the order of the estimates, the interpretation of the magnitude of the estimates is not clear. The estimates may reflect the Bayesian/gaming odds of each outcome, or the share of the vote, or something more subtle. Only repeated exercises of this kind can provide insight here.
The New Hampshire voters will vindicate our respondents judgement, or not, tomorrow!